

Who Is Participating Today?
Identifying Day Timeframe Rotation vs Higher Timeframe Initiative
If you missed our previous post in this Market Profile series, check it out here.
This is a topic I don’t see being talked about enough….
Early in my development, I would label a day as “trend” or “balance” and leave it there.
But that wasn’t enough.
Two trend days can look similar structurally and feel completely different to trade.
The difference is often not the shape.
It’s who is driving the auction.
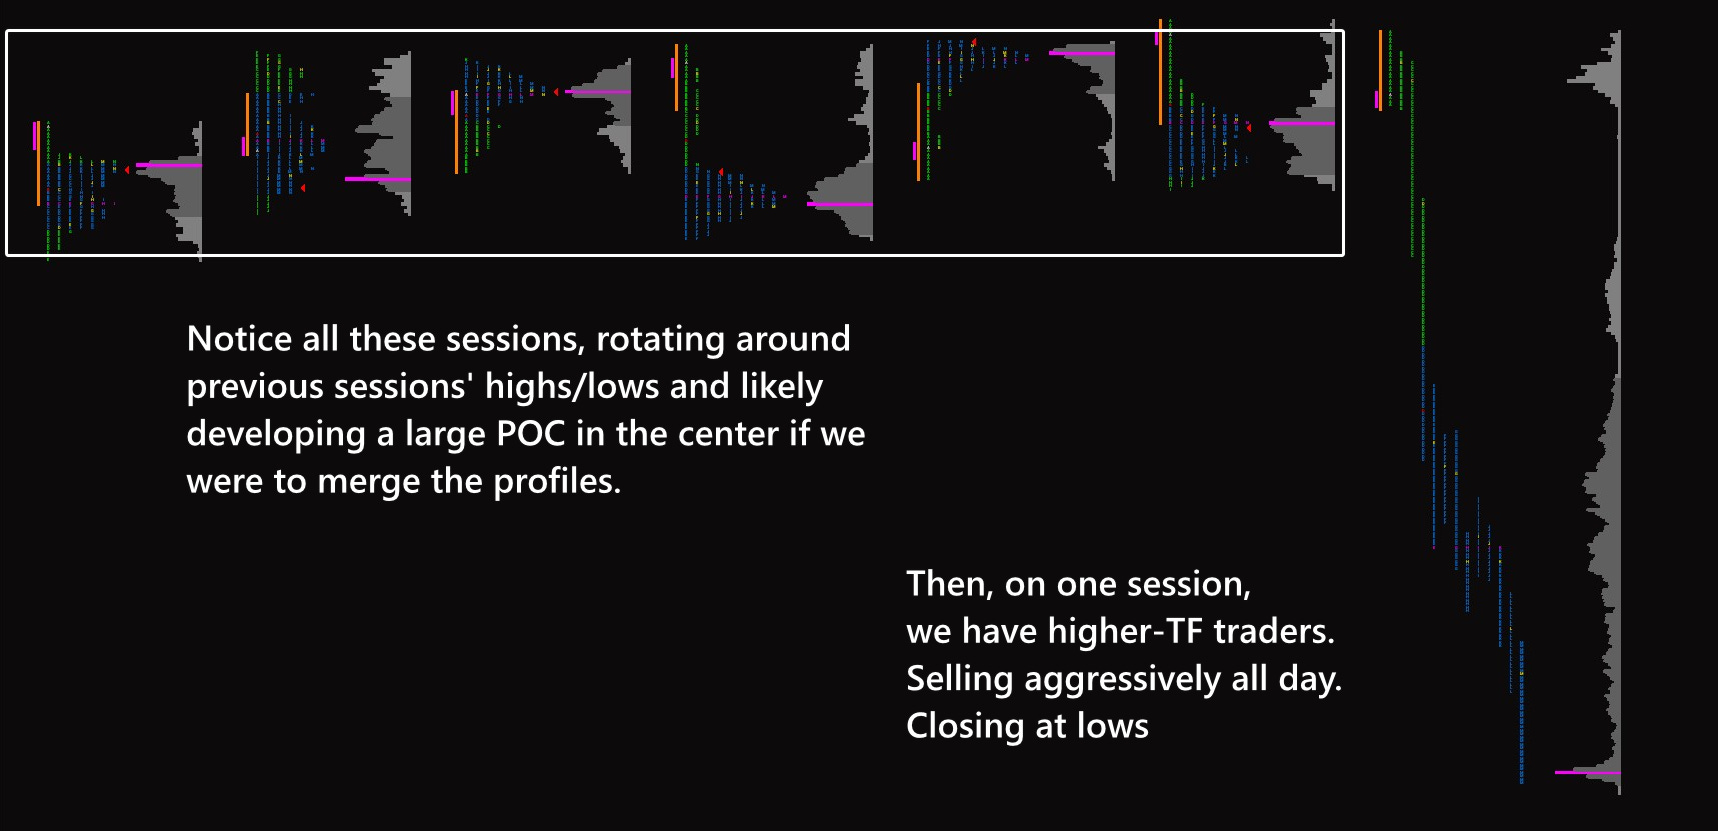
Day Timeframe vs Higher Timeframe
In simplified terms, there are two dominant participants in sessions:
Day timeframe traders.
Higher timeframe traders.
Day timeframe traders are responsive.
They care about references.
They often defend:
Prior day value.
Prior POC.
VPOC.
Overnight high and low.
Initial Balance extremes.
They rotate price between known areas.
Higher timeframe traders behave differently.
They initiate.
They don’t care about yesterday’s POC.
They’re not going to defend minor intraday levels.
They’re often positioning for something larger.
And therefore, you won’t see them every day.
When they step in, structure changes.
Respect vs Disrespect of References
One of the cleanest tells I’ve learned to watch for is this:
Are prior references being respected?
If ES opens inside prior value and immediately rotates around prior POC, day timeframe traders are likely dominating.
If price tests prior Value Area High and rejects cleanly, responsive trade is active.
But if ES opens and drives straight through: prior Value Area, prior POC, overnight extremes.
And does so without hesitation or meaningful pullback, that’s information.
That’s “disrespect”.
When references that normally matter are ignored, someone bigger is involved.
Higher timeframe traders don’t care about intraday fairness.
They care about positioning.
On those days, fading levels repeatedly can be expensive.
The better approach is often to align with the initiative and look for targets in larger composite structures.
One-Timeframing: Sustained Initiative
One-timeframing is another powerful clue.
When a market one-timeframes higher, each subsequent period makes a higher low.
It does not meaningfully rotate.
That type of behavior suggests:
Persistent buying.
Little responsive opposition.
Higher timeframe control.
The same applies to one-timeframing lower.
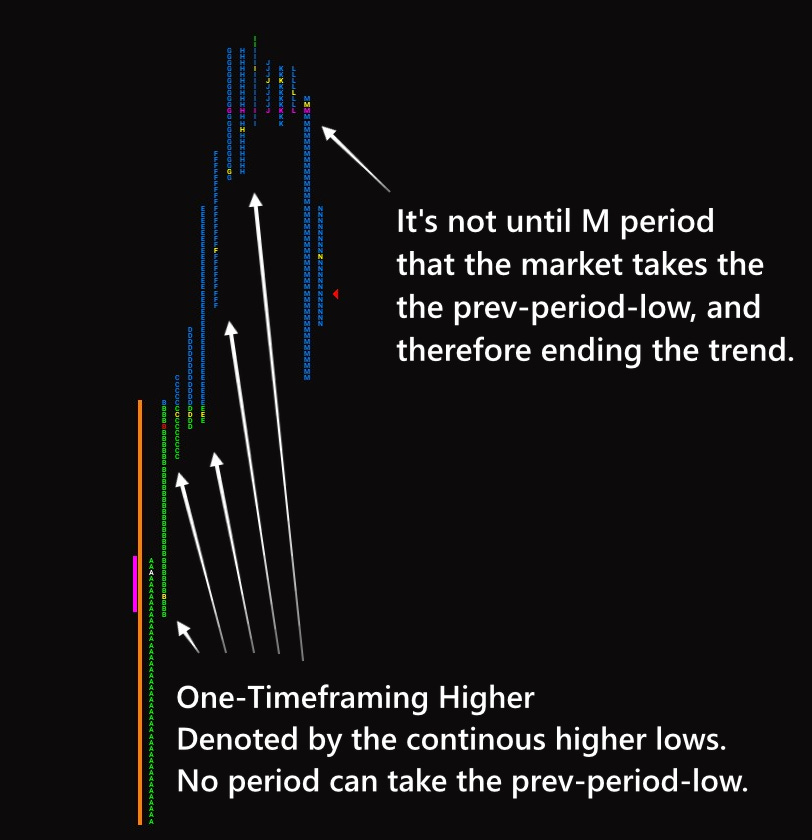
Day timeframe traders rarely sustain one-timeframing for long.
They take profits.
They fade extremes.
And create rotation.
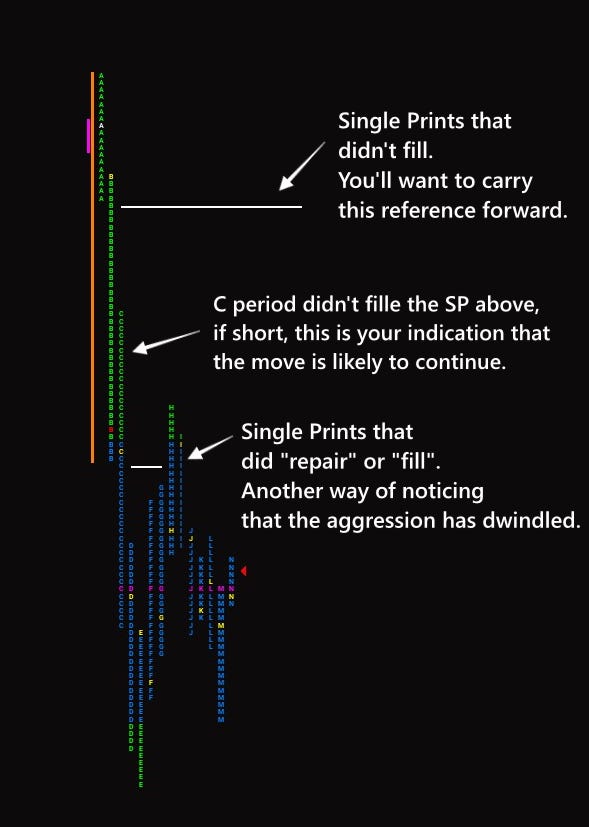
Single Prints and Elongation
Single prints often appear during strong initiative moves.
They represent prices that were quickly traversed and not revisited.
This is imbalance.
On higher timeframe driven days, you’ll often see:
Elongated profiles.
Limited rotation.
Clear single print zones.
Late session continuation.
In contrast, day timeframe dominated sessions tend to:
Repair structure.
Fill in single prints.
Rotate back toward value.
The market behaves differently depending on participation.
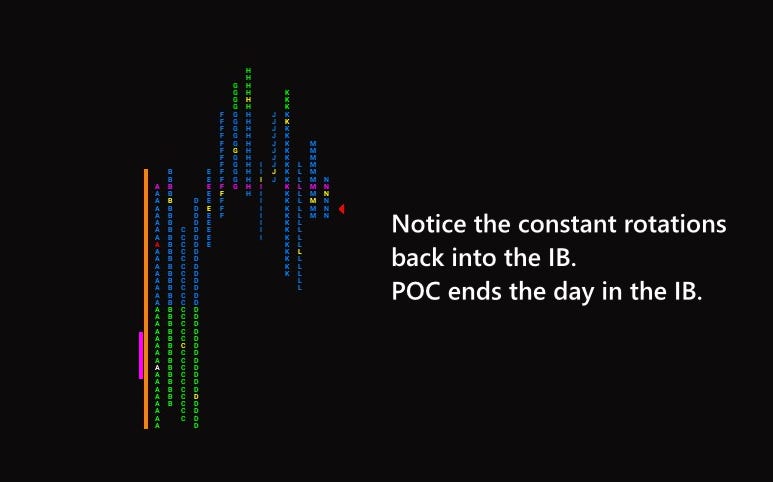
Tempo of Rotation
Another subtle tell is tempo.
On balanced days, ES often rotates methodically.
Push higher.
Stall.
Rotate back through value.
Test the opposite extreme.
It feels orderly.
On higher timeframe days, the pace often changes.
Pullbacks are shallow.
Breaks are decisive.
Time spent consolidating is limited.
You can feel urgency.
The tape moves differently.
When larger participants are active, the auction doesn’t need to negotiate every price.
It moves to where it needs to transact.
Range Extension That Holds
Range extension alone is not proof of higher timeframe involvement.
Range extension that holds is.
If ES breaks the Initial Balance high and:
Builds time above it.
Builds volume above it.
Develops value above it.
That suggests acceptance.
If instead it breaks, stalls briefly, and collapses back into range, those are weak hands.
On true higher timeframe days, the market rarely returns to clean up structure immediately.
It leaves unfinished business behind.
And that unfinished structure often becomes relevant in future sessions.
Volume Behavior Relative to Value
Volume also shifts character.
On balanced days, you’ll often see volume cluster around the POC.
Two-sided trade dominates.
On higher timeframe days, volume expands away from value.
The market is no longer negotiating fairness.
It is discovering new price.
When you see expanding volume and expanding range aligned, especially outside prior balance, initiative is likely present.
What This Means for Bias
Recognizing who’s participating should tell you how to interpret price action for the session.
If day timeframe traders are in control:
Expect rotation.
Fade extremes.
Be quicker to take profits.
Avoid chasing breakouts.
If higher timeframe traders are active:
Expect continuation.
Avoid fading strength.
Use pullbacks to get in.
Target other balance areas.
This is where composite profiles become useful.
If ES is breaking above prior day value and not looking back, the next logical reference may not be intraday.
But it may be:
A weekly high volume node.
A multi-day balance high.
A prior composite distribution.
Higher timeframe traders think in larger ranges.
Your targets should reflect that.
Other Tells to Watch
Over time, I’ve found additional subtle clues:
Opening outside prior value with immediate continuation.
Failure to rotate back to the POC after extension.
Late session strength instead of late session liquidation.
Acceptance above a prior multi-day balance high.
None of these alone guarantees higher timeframe control.
But together, they give you tangible information.
The key is confluence.
When the Market Stops Caring
The most expensive trades I’ve taken were fades on days the market clearly didn’t care about yesterday.
I would see price extend too far, too fast.
I would see distance from value.
And I would become a contrarian, because “it has to reverse” right?
But some days, ES is not negotiating. It’s repositioning.
That’s not imbalance looking to mean revert. That’s inventory shifting.
Higher timeframe participation doesn’t announce itself.
It reveals itself through indifference.
In the next post, we’ll zoom in on structural imperfections. Poor highs. Weak lows. Incomplete auctions.
Because even on strong days, the market leaves clues.
And sometimes the weakest structure becomes the strongest opportunity later.
If you liked this post, please help me out by liking and sharing!
Legal Disclaimer
The content provided in this newsletter is for educational and informational purposes only and does not constitute financial, investment, trading, or any other form of advice. All views, opinions, and analyses expressed are those of the author and should not be interpreted as personalized recommendations to buy, sell, or hold any security, futures contract, option, or other financial instrument.
Trading futures, options, and equities involves substantial risk of loss and is not suitable for all investors. Past performance is not indicative of future results. You should carefully consider your financial situation, risk tolerance, and objectives before engaging in any trading activity.
The author and Beyond Candlesticks make no representations or warranties regarding the accuracy, completeness, or suitability of the information provided. We shall not be liable for any errors, omissions, or delays in the content, or for any actions taken in reliance thereon.
You alone are responsible for your own trading decisions and outcomes. Consult a qualified financial professional before making any investment or trading decisions.