

What Market Depth Actually Represents
Understanding the difference between displayed intent and executed reality
The DOM was one of the first tools that felt like it offered direct access to the market.
It looked structured. Quantifiable. Precise.
And for someone who has a deep programming background, this really felt like the key.
There was always something to point to. Size at a level. Imbalance between bid and ask. Areas that appeared stable simply because they were large.
It kept me occupied for a while as I tried to make sense of it all. But that ended up being more of a problem than a solution.
What Market Depth Represents
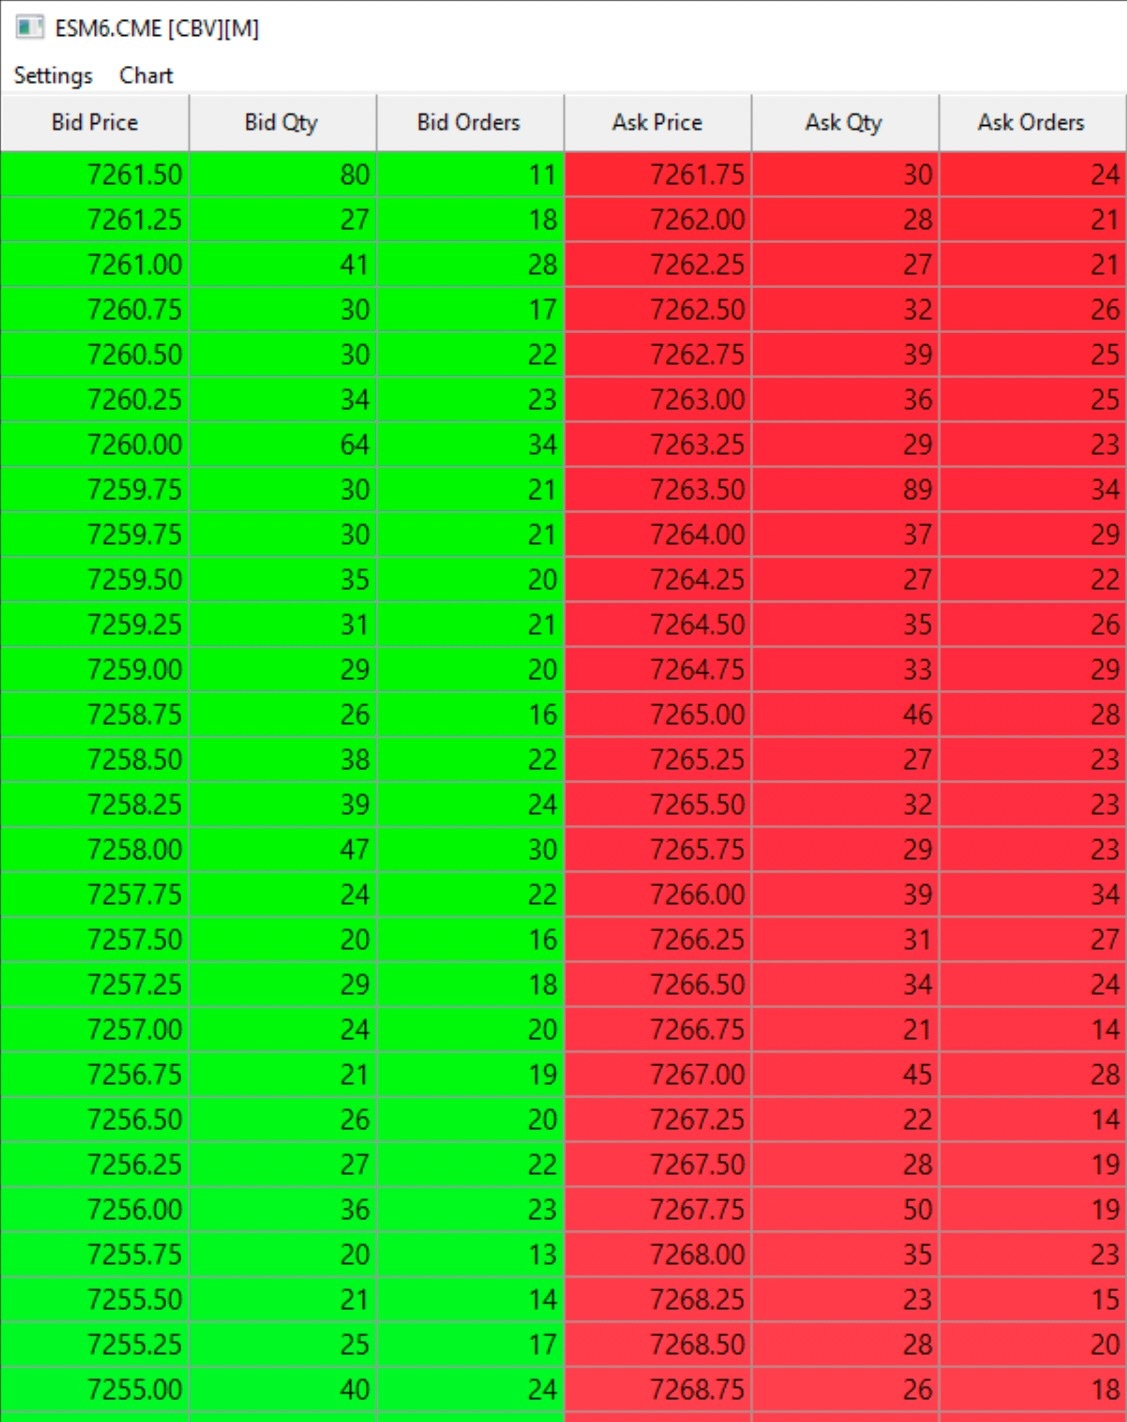
At a technical level, market depth is a real-time view of the limit order book.
It shows all resting limit orders at each price level, separated between bids (buy orders below price) and asks (sell orders above price).
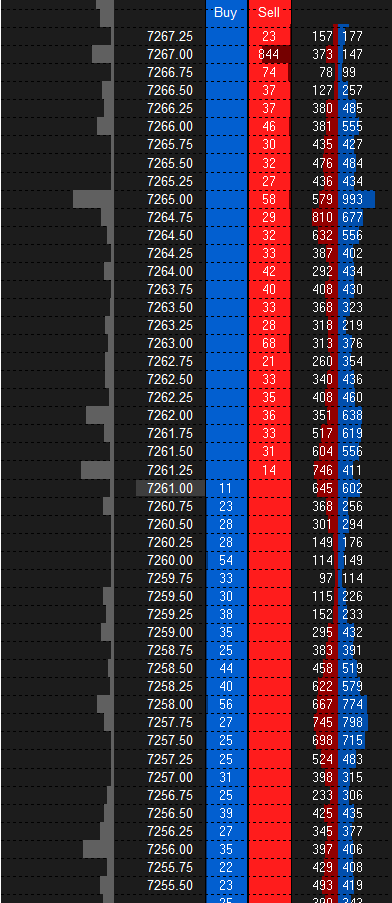
Each level reflects the quantity of contracts currently available to trade at that price, assuming those orders remain in place. Some platforms may also show the number of orders that make up the total available liquidity per price (as seen in the screenshot below).
What appears on the DOM is not aggregated volume from the past.
It is a live queue of pending interest.
Orders are constantly being added, cancelled, and modified. The book is not static for even a second.
When a market order enters, it executes against the best available limit orders. If the available liquidity at that level is fully consumed, price moves to the next level where liquidity exists.
This is why price movement is directly tied to how quickly liquidity is removed, not how much is displayed.
Every resting order exists under a condition: It remains there as long as the participant behind it is willing to leave it in place. That willingness is not fixed. It changes with price, with timing, and with what starts trading into it.
So what appears stable often isn’t.
It’s just untested.
Where the Disconnect Comes From
There is a moment that tends to repeat.
Price approaches a level with visible size.
It looks like it should slow down.
Instead, it trades through it with little resistance.
Nothing about the display suggested that outcome.
But nothing in the display guaranteed the opposite either.
That is where the distinction becomes clearer: The book shows potential liquidity. Execution shows what was actually accepted.
Price only reflects the latter.
Passive Liquidity and Active Pressure
At a structural level, the interaction is simple.
Limit orders sit and wait.
Market orders initiate and cross.
Only one side applies pressure.
When aggressive flow meets available liquidity, one of two things happens: Either its absorbed and price holds, or it isn’t and price continues.
The size itself is not the deciding factor.
The response to that size is.
When one side is demanding more, it’ll eat up the supply available and continue onwards.
How Size Tends to Be Interpreted
Large orders naturally draw attention.
They stand out, and they offer something that feels like structure.
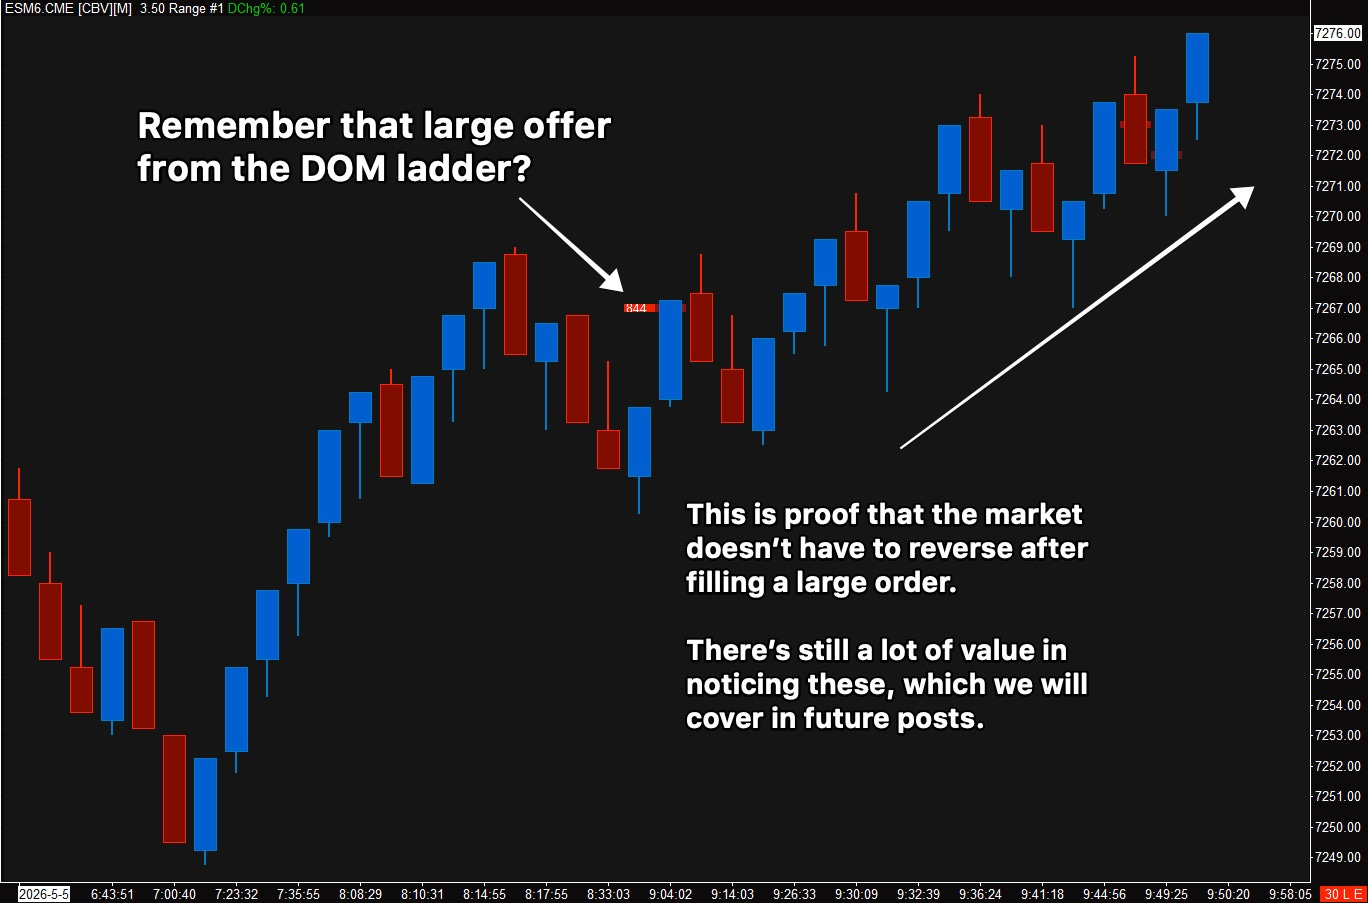
But over time, it becomes less useful to focus on how large something is, and more useful to observe how it behaves.
Some levels hold repeatedly with relatively modest size.
Others appear significant and offer little resistance once tested.
The difference is not visibility.
Its whether that liquidity remains in place when it starts to matter and once it fills, what occurs afterwards.
Display vs Participation
Another separation becomes more relevant with screen time.
Displayed liquidity is what is available before interaction.
Executed liquidity is what participants were willing to trade.
The first is static.
The second is conditional and constantly updating.
Price does not respond to what is visible.
It responds to what is being transacted.
A level with size that does not trade is neutral.
A level where liquidity is consistently taken and not replaced tends to move.
A Different Way to Look at It
Not many traders evolve to this stage before giving up on market depth but for those who do…. at some point, the focus shifts away from reading the book as just a set of levels and into an interpretation of the behavior behind them.
More attention goes to how liquidity behaves as price approaches it.
Does it stay in place?
Does it thin out?
Does it get consumed without slowing the move?
Does it chase price or does it move further out?
What happens after it fills?
Those observations tend to carry more weight than the numbers themselves and where the “art” in reading that behavior comes in play.
Where This Leaves Market Depth
Market depth stops functioning as something to rely on directly.
It becomes a way to observe intent as it forms and adjusts. A level of context.
Not something to predict with.
More something to contextualize what is already starting to happen.
From there, the emphasis naturally moves towards understanding that behavior, where intent either holds or fails.
Legal Disclaimer
The content provided in this newsletter is for educational and informational purposes only and does not constitute financial, investment, trading, or any other form of advice. All views, opinions, and analyses expressed are those of the author and should not be interpreted as personalized recommendations to buy, sell, or hold any security, futures contract, option, or other financial instrument.
Trading futures, options, and equities involves substantial risk of loss and is not suitable for all investors. Past performance is not indicative of future results. You should carefully consider your financial situation, risk tolerance, and objectives before engaging in any trading activity.
The author and Beyond Candlesticks make no representations or warranties regarding the accuracy, completeness, or suitability of the information provided. We shall not be liable for any errors, omissions, or delays in the content, or for any actions taken in reliance thereon.
You alone are responsible for your own trading decisions and outcomes. Consult a qualified financial professional before making any investment or trading decisions.