

Understanding Order Flow Pt 1
Structure, Participation, and Context

Let’s start with a simple truth:
Price does not move because of indicators.
Price moves when aggressive trades consume liquidity, or when liquidity withdraws.
And Order flow is the study of those trades.
At its most basic level, order flow is the real-time interaction between buyers and sellers.
Who is trading, how aggressively they’re trading, and whether that activity is actually moving price.
Every market move comes from either one of these two things:
Buyers lifting offers or sellers hitting bids, sometimes amplified by thin liquidity.
Sometimes that movement is amplified not because aggression increased, but because liquidity disappeared.
When passive participants (traders, dealers, algorithms) step away, price can move easily even without heavy aggression.
Everything else you see on a chart is a summary of that interaction after the fact.
Candles, bars, patterns… they describe what happened. Order flow describes how it happened.
This distinction is important.
For example, a five-minute candle can close bullish for multiple reasons:
Buyers overwhelmed sellers and forced price higher
Buyers were aggressive, but sellers absorbed them and allowed price to drift
Short covering pushed price without new demand
Liquidity was thin, and price moved easily
Visually, those candles can look identical. Structurally, they are very different.
Order flow answers: Is price moving due to strong participation or weak resistance?
The Auction: How Price Is Discovered
Markets operate as a continuous auction where:
Buyers lift offers urgently
Sellers hit bids urgently
Passive participants rest orders for liquidity
Aggressive participants act with initiative; they attempt to force price.
Passive participants are responsive; they absorb, defend, and facilitate trade.
Price moves when aggression consumes liquidity or liquidity withdraws.
This interaction unfolds continuously, whether over seconds or over several rotations.
Let’s put it like this:
If aggressive buying cannot move price higher, that buying is being absorbed.
If aggressive selling cannot move price lower, that selling is being absorbed.
Aggression expresses intent.
Price movement reflects outcome.
Absorption alone does not imply reversal.
Sometimes it leads to continuation, sometimes to failure.
Order flow allows this interaction to be observed as it develops in real time.
Not as a prediction tool.
Not as a signal generator.
But as information for you to interpret.
Order Flow Data
Order flow describes auction function via two inputs:
Executed trades
What actually traded, at what price, and with what size.Resting liquidity
What was available to trade but did not, inferred through how price responded when specific levels were tested.
Derivatives like delta, footprint bars, volume profiles, and imbalances organize these for interpretation.
Because order flow is built on executed trades, it is inherently retrospective. It reflects what participants have already done, not what they intend to do next.
Participation can only be observed once someone acts.
Order flow does not predict where price will go.
It provides context for how price is behaving right now, whether current activity supports continuation, stalling, or potential failure within the existing structure.
Examples:
Strong buying delta with little movement: Participation meets resistance.
Weak participation in breakout: Fragile engagement.
Sustained pressure: Commitment despite slow advance.
None of these observations instruct a trade. They describe the efficiency of the auction as it unfolds.
This is why order flow must always be interpreted within both timeframe and structural context.
The same activity can represent continuation on one timeframe and absorption on another.
Delta: What It Measures and How to Use It
Every executed trade happens for one of two reasons:
A buyer hits the offer
A seller hits the bid
Delta tracks this imbalance.
Delta is simply: Aggressive buys − Aggressive sells
Nothing more.
Delta does not determine direction.
It does not identify winners or losers.
And it does not predict what price must do next.
It describes how participation occurred, not the outcome of that participation.
Delta vs. Volume
Volume and delta both answer different questions.
Volume tells you how much traded.
Delta tells you who crossed the spread more.
Because of this, they cannot be used interchangeably.
Examples:
High volume, flat delta → Balanced aggression
Positive delta, flat price → Absorbed buying
Negative delta, falling price → Successful selling
This is why volume and delta must be read together.
Volume answers whether participation exists.
Delta answers who was aggressive.
Price answers whether it mattered.
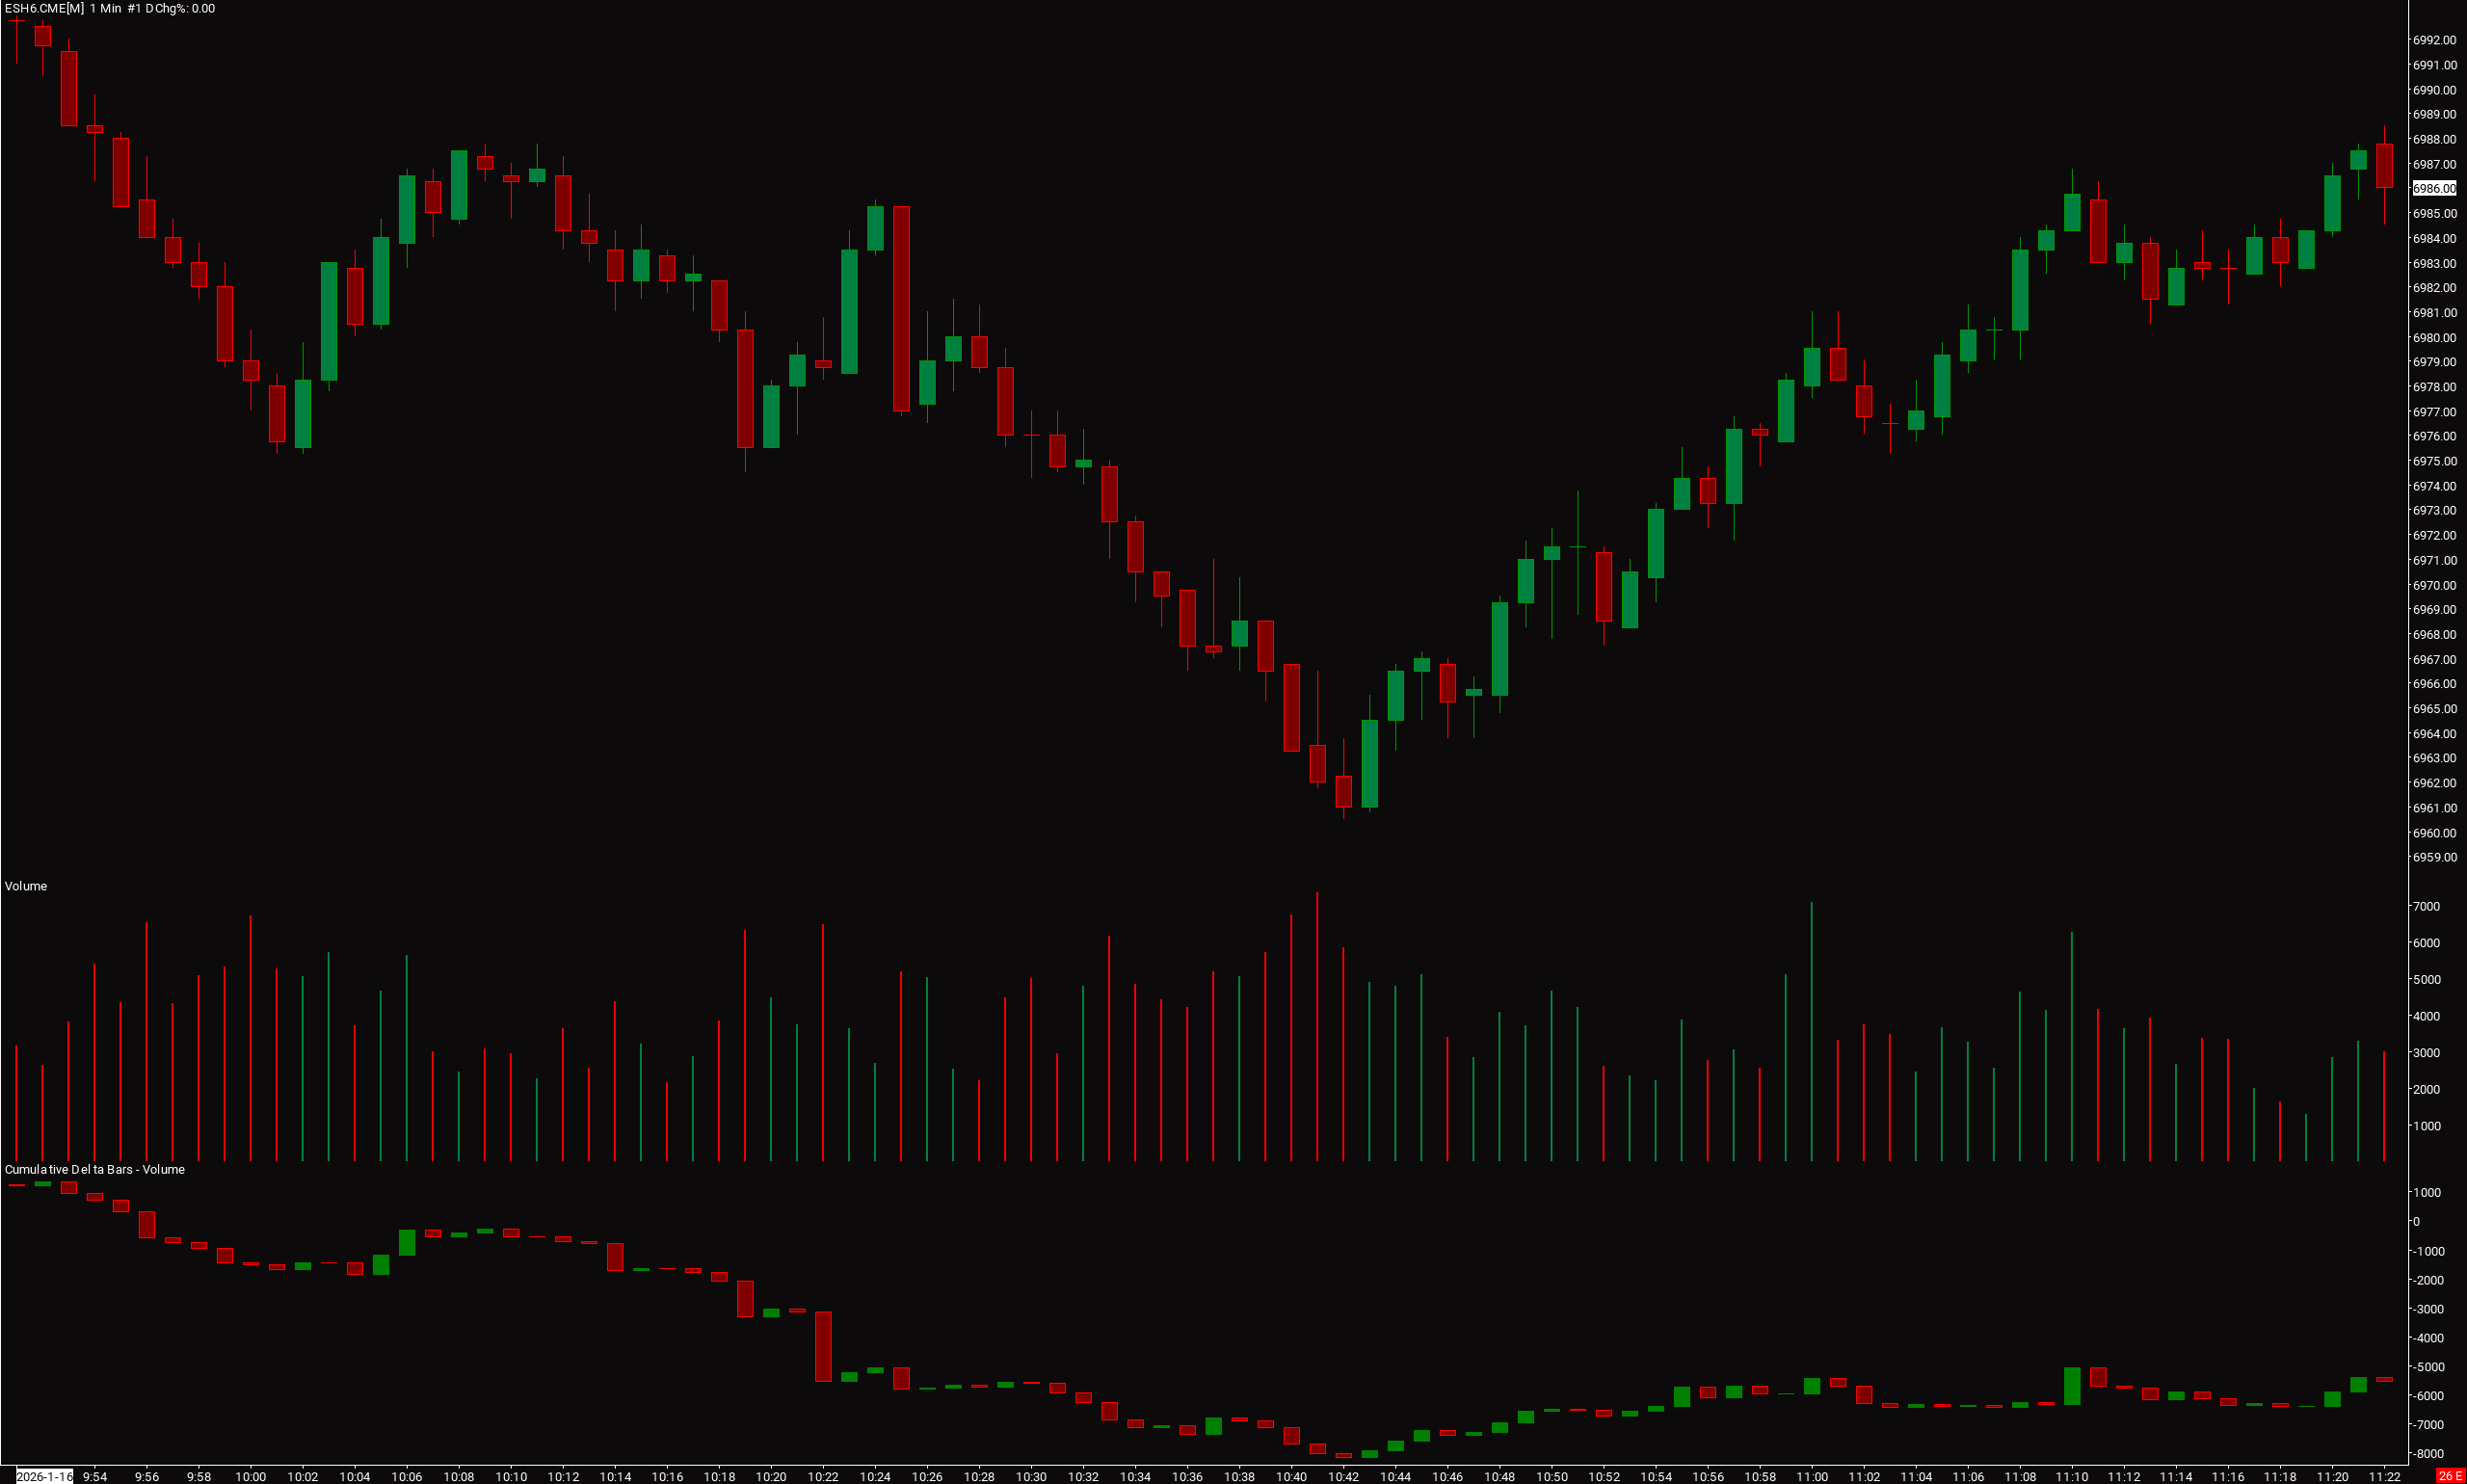
Do the following exercise for yourself.
Using the chart below, what nuances in the data can you notice?
Interpreting Delta in Context
Delta has meaning only when it’s placed within structure.
Aggressive activity can be:
Forced rather than discretionary
Absorbed by larger resting liquidity
For this exact reason:
Positive delta does not guarantee higher prices
Negative delta does not guarantee lower prices
Think of delta as effort, not authority.
Aggression can be loud without being effective.
Control is established by response, not intensity.
Delta tells you how hard the auction is pushing.
Price tells you whether that push is working.
Initiative vs. Absorption
Aggressive activity alone does not determine outcome.
What really matters is whether that activity is able to force price to reprice.
This is the distinction between initiative and absorption.
An initiative activity occurs when one side of the market is both willing and able to move price away from prior value.
Initiative behavior typically includes:
Buyers lifting offers or sellers hitting bids
Resting liquidity failing to absorb that pressure
Price being forced to reprice as one side gains control of the auction
When initiative is real and maintained, price progression becomes efficient.
Some common characteristics to look out for
Aggression aligns with price movement
Pullbacks are shallow or brief
More traders pile on in the direction of the move even at more unfavorable prices
New value begins forming away from prior balance
In these conditions, price does not need encouragement to move. Liquidity yields, and structure advances naturally.
But initiative is not permanent. When follow-through weakens, initiative often transitions into absorption.
Absorption: When Aggression Fails to Move Price
Absorption occurs when aggressive participation continues, but price stops responding.
This typically appears when:
Aggressive buyers repeatedly hit offers but they continue to refill
Or aggressive sellers repeatedly hit the bid but more buyers stack the bid
And price fails to push through that supply/demand zone
This behavior indicates the presence of a passive counterparty willing to absorb that flow at that price.
Something to keep in mind:
Absorption is not a lack of interest. It simply reflects intent. Someone is willing to transact size at that price.
This is why markets can display:
Heavy buying at highs without continuation
Sustained selling into lows that fails to break structure
Expanding delta with little net price change
Progress slows, but the market still stays active.
Absorption does not imply outcome.
It may represent accumulation, distribution, inventory transfer, or positioning ahead of reversal.
Context determines which.
Inventory
Much of what absorption reveals is not a lack of interest, but inventory management.
Participants are constantly balancing exposure, risk limits, and obligations. When large participants absorb aggressive flow, they are often managing inventory rather than expressing directional conviction.
This is why heavy buying can occur without continuation, or sustained selling can fail to break structure. Price is not being allowed to move because inventory is being transferred, defended, or reduced.
Order flow does not show inventory directly, but it reveals its effects through price response.
Why Location Matters
This is important: Order flow does not carry equal meaning everywhere.
The same behavior can be trivial in one area and highly informative in another, depending on where it occurs within market structure.
Location determines whether order flow is revealing new information or simply facilitating trade.
When activity develops near well-defined structural boundaries, prior highs/lows, value extremes, or areas of acceptance and rejection, the market is being forced to make a decision. Participation in these areas tends to be more purposeful, as one side is attempting to defend or violate an established reference.
Order flow at these locations often exposes intent.
By contrast, activity that develops in the middle of established balance is usually informationally weaker. Participation here often reflects inventory exchange rather than directional commitment.
Price can remain active without progressing, not because effort is absent, but because neither side is incentivized to force resolution.
The behavior may look identical on a footprint or delta chart.
Its meaning is not.
Location provides the context that tells you whether order flow is simply maintaining trade or actively reshaping structure.
This is why order flow cannot be read in isolation.
Behavior explains what is happening.
Location explains why it matters.
Order flow is not about finding certainty or predicting direction.
It is about understanding how participation and liquidity interact within structure.
Initiative, absorption, and location do not provide answers on their own.
They provide context. That context is what allows price behavior to be read as an evolving auction rather than a series of isolated candles.
I hope you’ve enjoyed Part 1 of this post.
Part 2 coming soon.