

Structural Imperfections and Subtle Clues
Watch out for nuances
If you’re new to Market Profile, take some time to go through our earlier posts to learn the basics.
Early on, I was obsessed with clean structure.
Balanced profiles….Clear breakouts….Symmetry.
It felt safer when the auction looked orderly.
Over time, I realized the most useful information often lives in the imperfections.
Market Profile does not just show you where the market was comfortable.
It also shows you where it was sloppy.
And sloppy structure usually carries information forward.
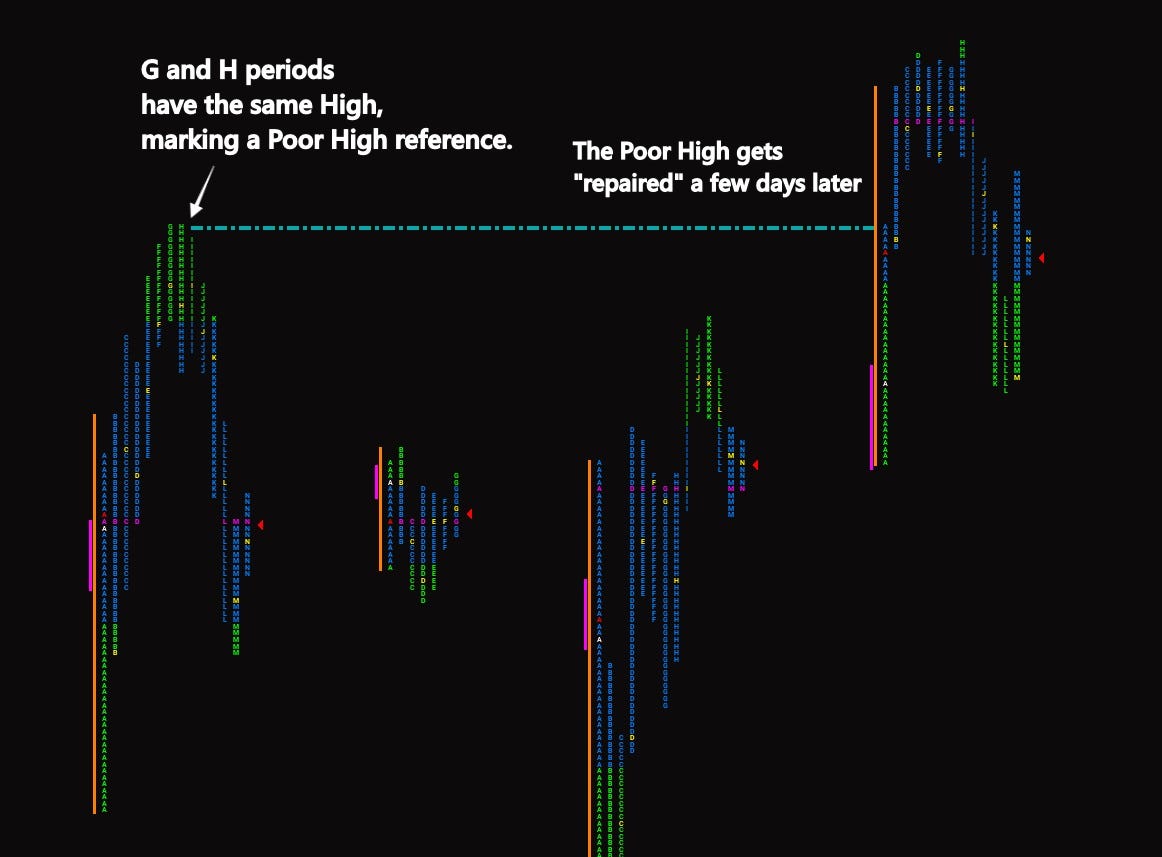
Poor Highs and Poor Lows
A poor high or poor low forms when a session ends at an extreme without excess.
In practical terms, that means there is no clear rejection tail. No meaningful sign that the auction completed.
Instead of tapering off, the profile simply stops.
On ES, this often looks like multiple TPOs or heavy volume stacked right at the high or low, with no sign of exhaustion. Give or take a tick or two (perfection kills).
That structure suggests unfinished business.
Day timeframe traders are usually responsible for these levels. They trade up to an extreme, but no larger participant steps in to shut down the auction decisively.
The result is mechanical structure.
Mechanical structure is fragile.
When I see a poor high, I don’t immediately assume price must break it the next day. But I treat it as a reference that is more vulnerable than a high with clean excess.
Excess implies completion.
Poor structure implies the auction there didn’t finish.
Weak References
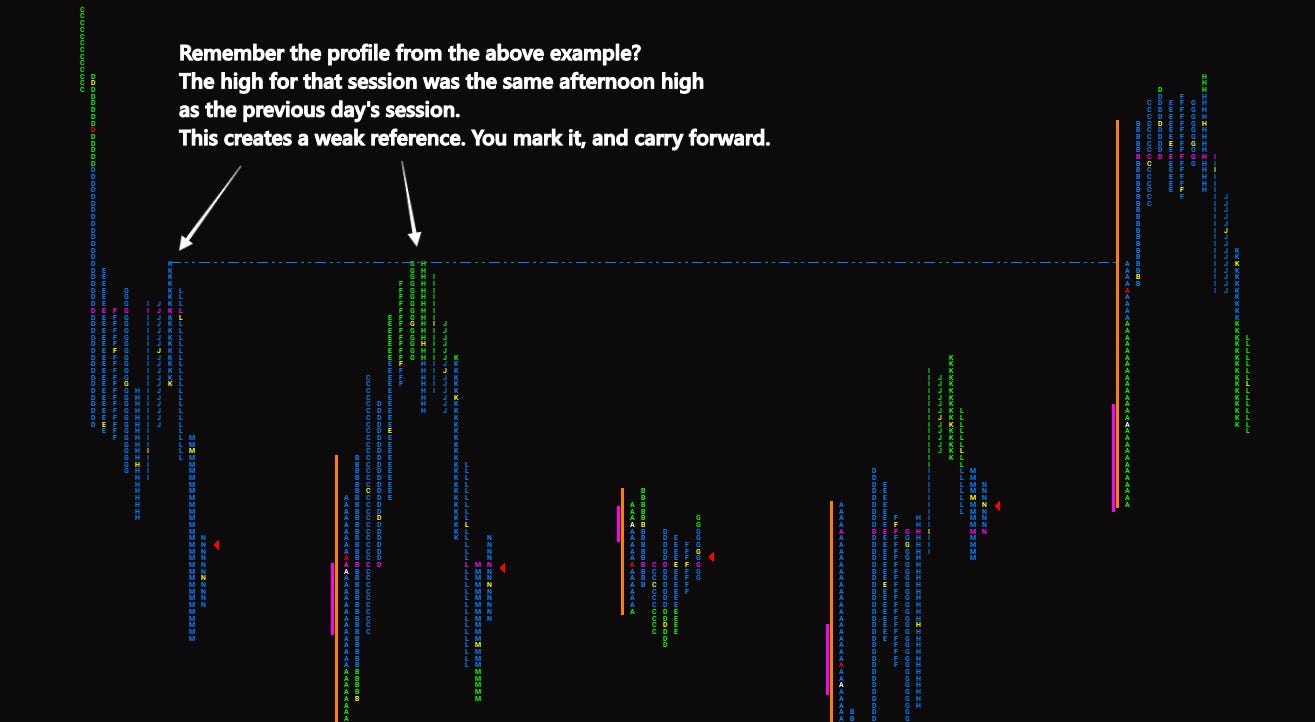
Weak highs and lows are closely related.
A weak high often forms exactly at a prior reference:
Prior day high.
Prior Value Area High.
A prior single print.
If price tags the level precisely and rotates away, it may look technically clean.
But precision can be a clue.
Higher timeframe traders rarely care about exact prior session references. They operate in broader zones.
When structure forms with exact symmetry at obvious references, it often reflects short-term traders leaning against levels.
Short-term traders leave footprints that are easy to see.
And easy-to-see structure is often easy to break later.
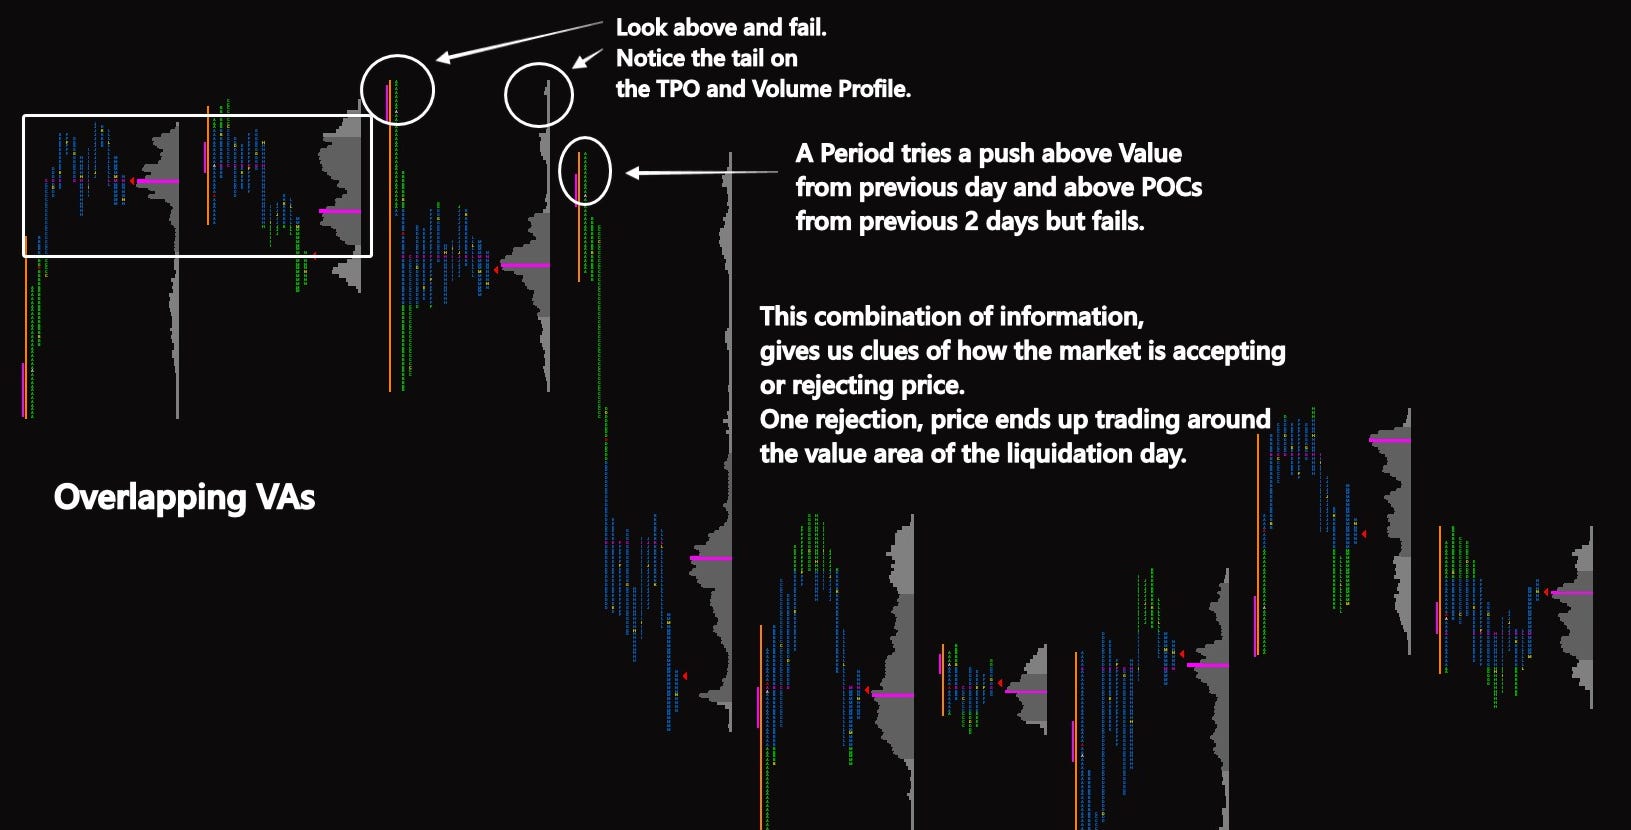
Look Above and Fail, Look Below and Fail
One of the most powerful structural tells is the failed auction.
A “look above and fail” occurs when price breaks above a prior high, attracts participants, and then rotates sharply back into range.
The breakout fails.
The same applies in reverse with a “look below and fail.”
These patterns are not just about false breakouts.
They reflect trapped inventory.
When price fails after attracting participation beyond a known level, those traders are now wrong. Their exits fuel rotation in the opposite direction.
Failed auctions often produce strong responsive moves.
But again, context is critical.
A failed breakout inside balance is different from a failed breakout during a broader initiative trend.
Structure alone does not define the outcome. Location and context do.
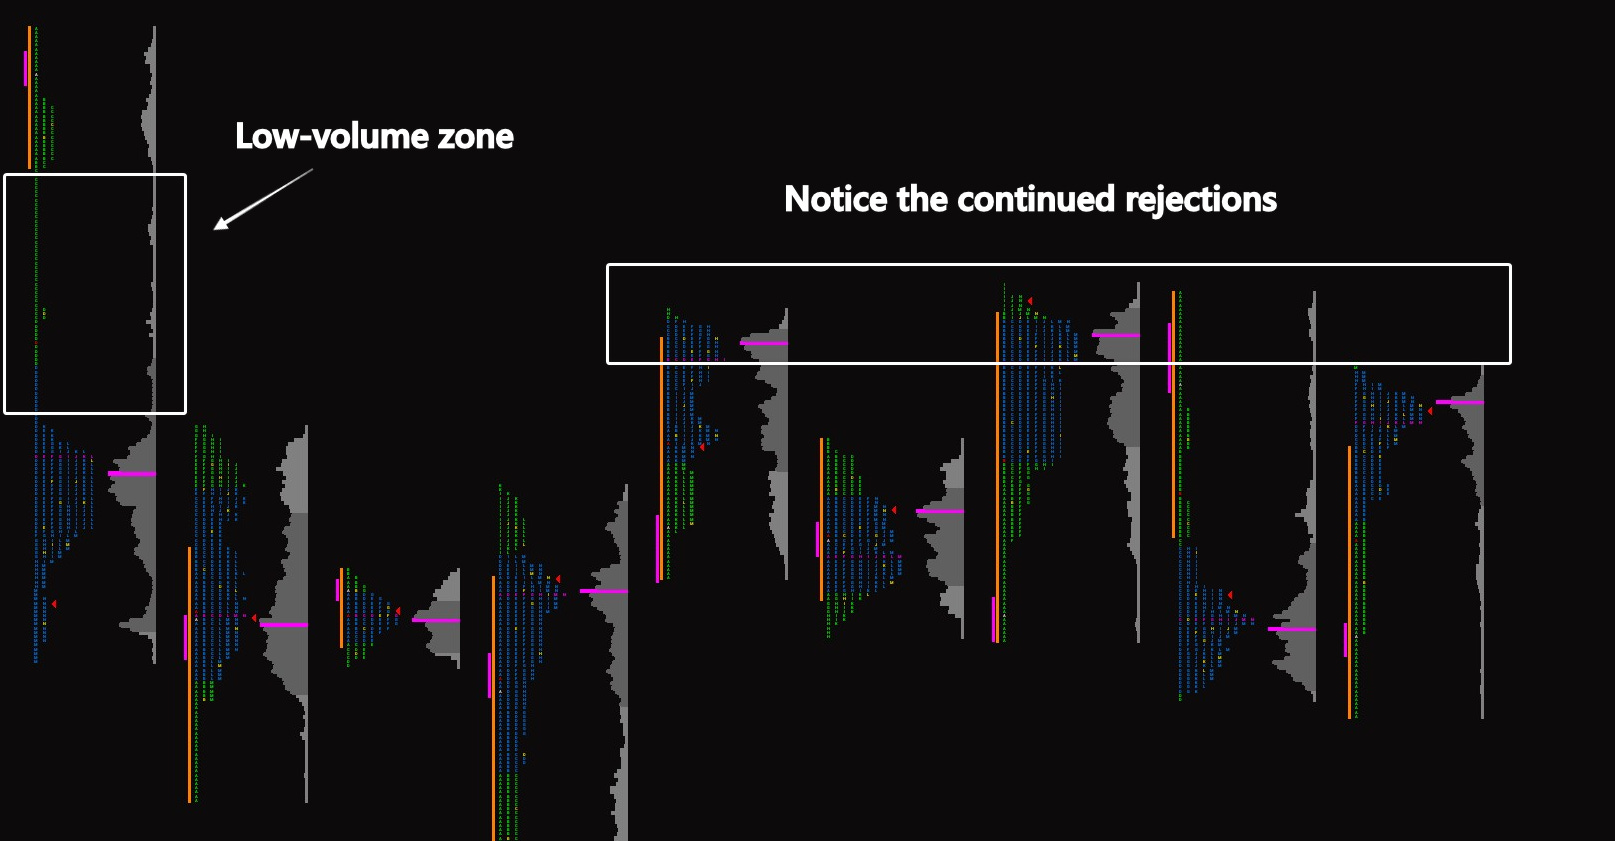
Low Volume Nodes and High Volume Nodes
Volume Profile adds another layer of nuance.
High Volume Nodes represent areas of heavy acceptance. The market transacted significant business there.
Low Volume Nodes represent rejection or swift movement.
HVNs tend to act as magnets during balanced conditions. Price rotates toward them because they represent comfort.
LVNs tend to act as rejection zones. When price approaches them from within value, it often moves through them quickly.
But context matters.
On initiative days, LVNs can form mid-move and never get repaired. On balanced days, they are often revisited and filled.
When you begin marking LVNs and observing how price behaves around them, you’ll noticed something consistent:
In rotational environments, inefficiencies get repaired.
In initiative environments, inefficiencies are often left behind.
The difference is participation.
Repair vs Continuation
Not all imperfect structure gets repaired immediately.
On balanced days, the auction tends to clean itself up. Single prints get filled. LVNs get revisited. Poor highs get retested.
On strong initiative days, the market often leaves inefficiencies behind.
When higher timeframe traders are active, they do not care about cosmetic symmetry. They care about positioning.
This distinction matters for expectation.
If the session is balanced and I see poor structure forming, I expect repair sooner rather than later.
If the session is clearly initiative-driven, I’m cautious about assuming immediate mean reversion.
The auction behaves differently depending on who is involved.
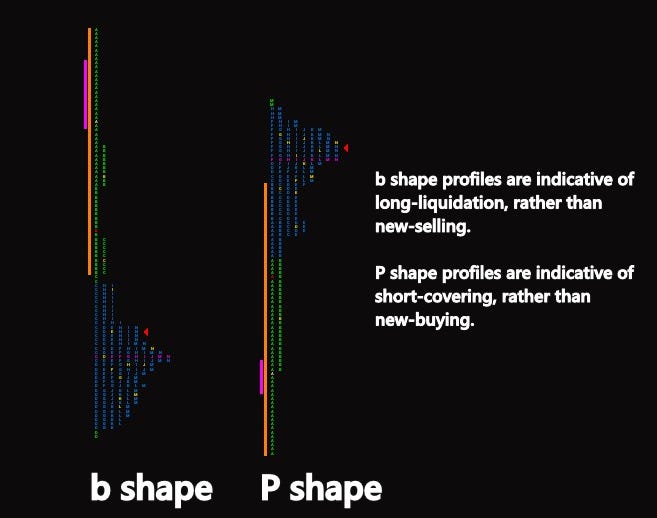
Short Covering vs Long Liquidation
Profiles can also hint at whether movement is driven by fresh initiative or position unwinding.
Short covering rallies often move quickly but lack sustained structure. They can produce sharp spikes that later rotate.
Long liquidation breaks can behave similarly in reverse.
Initiative activity, by contrast, tends to build new value away from prior balance.
Distinguishing between inventory adjustment and new positioning is not always obvious.
But over time, the differences become visible in how structure develops and whether value migrates.
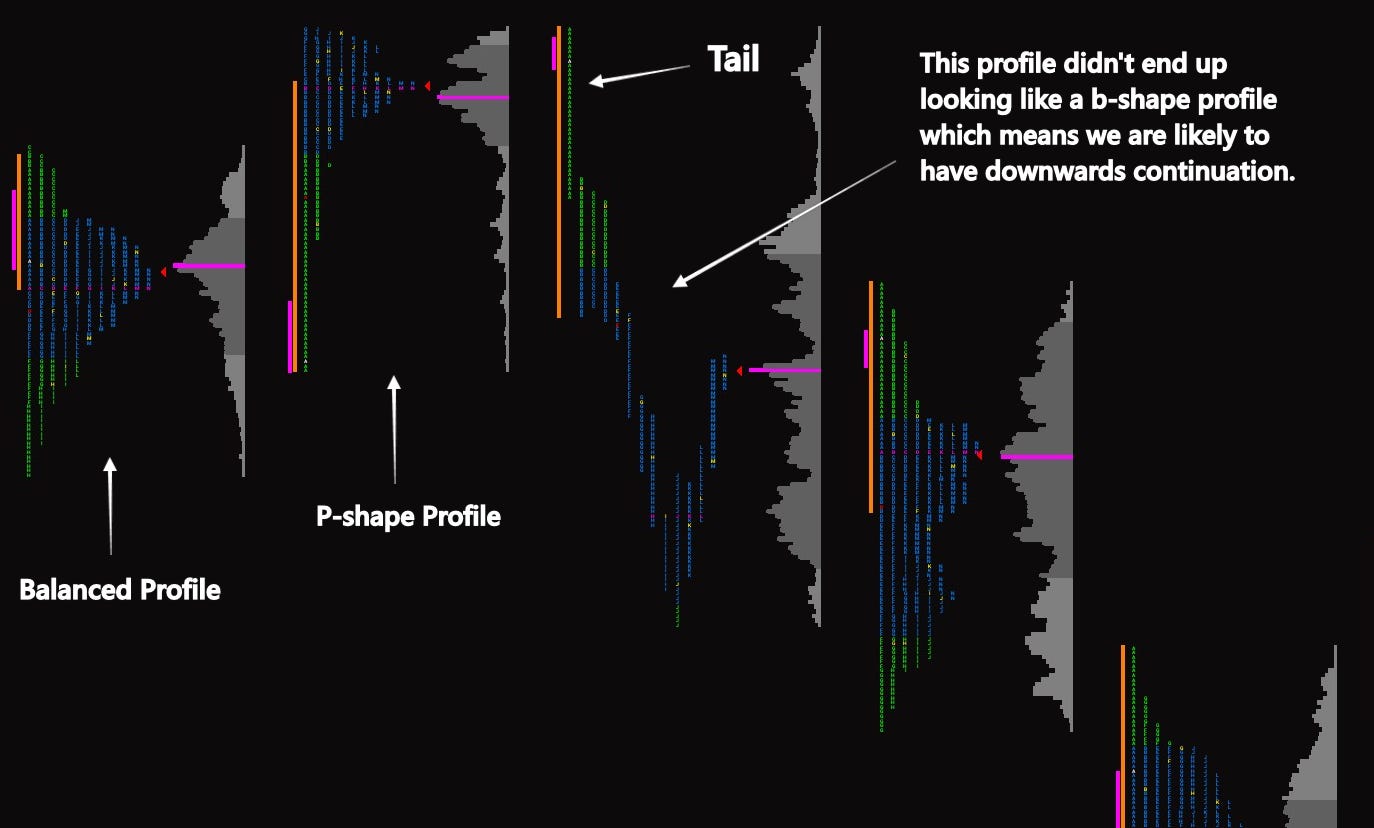
Excess and Tail Formation
Excess is the opposite of poor structure.
Excess appears as a tail at the extreme of the profile, where price quickly auctions beyond a level and is firmly rejected.
In TPO terms, you’ll see single prints at the extreme followed by immediate rotation back inside.
In Volume Profile, you’ll often see thin volume at the extreme compared to the body of the distribution.
Excess suggests that the auction probed for more business and found none.
That kind of rejection often completes the auction in that direction, at least temporarily.
When I see clean excess at a high, I’m interested in playing the mean reversion trade. I don’t enter blindly, but I’ll use order flow for my entries.
Excess often represents short-timeframe traders taking profits which end the move.
It can also be indicative of higher-timeframe traders offering too much inventory for short-timeframe traders to consume.
Overnight Inventory Imbalance
Another nuance that took time to appreciate is overnight inventory.
ES trades nearly around the clock. Overnight sessions can build directional inventory before the regular session begins.
If overnight inventory is heavily long and the regular session opens inside value, responsive sellers may push price lower to rebalance.
If overnight inventory is short and price opens above prior value, short covering can fuel early continuation.
Knowing this has been a very fruitful edge for me.
Overnight structure adds context to what unfolds during regular hours.
Imperfection as Information
I used to prefer sessions that looked clean and textbook.
Now I pay more attention to the messy ones.
Poor highs.
Unfinished auctions.
Weak references.
Thin structure left behind.
These are not flaws.
They are clues.
Market Profile is not just about identifying balance and imbalance. It’s about identifying fragility.
Where is the structure vulnerable?
Where is it complete?
Where is it unfinished?
Those questions often matter more than the shape itself.
In the next post, we’ll zoom out.
Because sessions don’t exist in a vacuum.
Profiles only make full sense when viewed relative to other profiles.
If you enjoyed this free post, please help us out by liking and sharing!
Legal Disclaimer
The content provided in this newsletter is for educational and informational purposes only and does not constitute financial, investment, trading, or any other form of advice. All views, opinions, and analyses expressed are those of the author and should not be interpreted as personalized recommendations to buy, sell, or hold any security, futures contract, option, or other financial instrument.
Trading futures, options, and equities involves substantial risk of loss and is not suitable for all investors. Past performance is not indicative of future results. You should carefully consider your financial situation, risk tolerance, and objectives before engaging in any trading activity.
The author and Beyond Candlesticks make no representations or warranties regarding the accuracy, completeness, or suitability of the information provided. We shall not be liable for any errors, omissions, or delays in the content, or for any actions taken in reliance thereon.
You alone are responsible for your own trading decisions and outcomes. Consult a qualified financial professional before making any investment or trading decisions.