

Footprint Charts
Seeing the transactions behind the candle
For a long time, candlesticks were enough for me.
If I’m being honest, it’s because I didn’t know any better.
They showed direction, momentum, and structure. They helped frame risk. They gave me a way to participate in the market without overthinking every tick.
But as someone who is curious about how things work, I needed to understand the market at a deeper level.
Why did price stall here?
That breakout fail instantly, why?
How come we reversed right here?
Those questions are what eventually push traders toward order flow. And that’s where footprint charts enter the picture.
Why Candlesticks Eventually Fall Short
Candlesticks summarize what already happened.
They tell you where price opened, traded, and closed.
What they don’t show is how price got there...
A green candle can be driven by aggressive buyers lifting offers.
It can also be driven by sellers pulling liquidity.
Or even form while aggressive buying is being absorbed.
All of those scenarios look identical on a candle.
From an order flow perspective, they are completely different auctions.
At one stage, I tried solving that gap with more indicators.
RSI to tell me if we were overbought, MACD to confirm momentum…Stochastics to refine timing.
Good ‘ol Fibonacci to project random lines that work when you “use it correctly”.
And at one point, even Ichimoku Kinkō Hyō, because if you’re going to confused the sh*t out of yourself, you might as well go all in.
The problem wasn’t that these tools are useless. The problem was that they are all derivatives of price.
They rearrange what has already happened. But they don’t show who is actually trading.
Once you start getting curious about how price actually moves, that abstraction becomes a problem.
What a Footprint Chart Actually Is
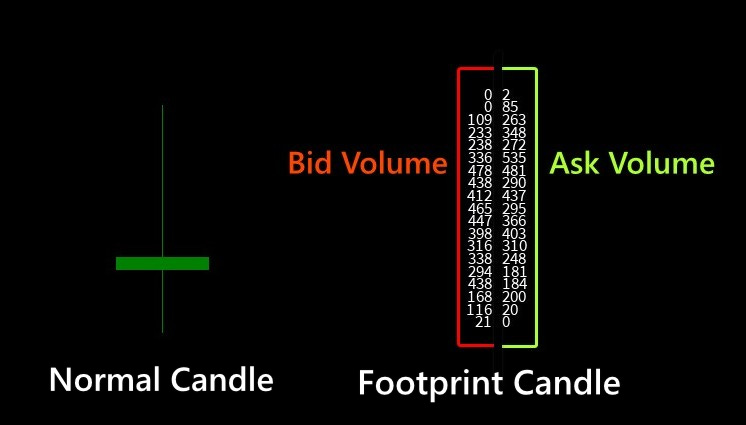
A footprint chart breaks each bar down by price level and displays how much volume traded on the bid and on the ask.
Instead of seeing one number for volume, you see participation.
And, instead of seeing direction implied by a candle body, you see who initiated trades and where.
At every price level, the footprint answers a simple question:
Who was willing to trade here, and how aggressively?
Some footprints are time-based. Others are volume-based or range-based. The structure can vary, but the purpose stays the same. They expose the internal mechanics of each bar.
Reading a Footprint Is About Context, Not Numbers
It’s tempting to treat footprint charts like a math problem.
Big numbers must mean strength.
Positive delta must mean buyers are in control.
Negative delta must mean sellers are winning.
That mindset will fail you quickly.
Volume only has meaning relative to location. And delta only matters in relation to price response.
Aggressive buying that pushes price higher tells a very different story than aggressive buying that fails to move price at all.
Footprints don’t give answers in isolation. They give evidence and positioning. The job of the trader is to interpret that evidence within structure.
What Footprints Reveal That Candles Cannot
Footprint charts make certain behaviors visible that are otherwise invisible.
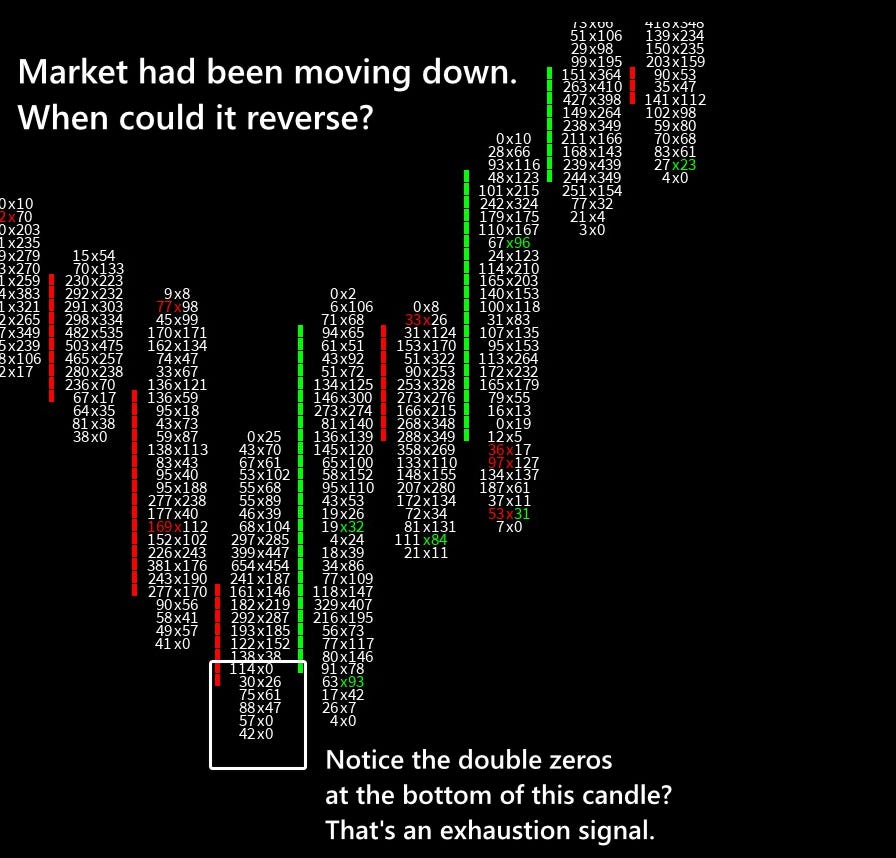
They show absorption, when aggressive traders keep hitting into resting liquidity without progress.
They show exhaustion, when effort suddenly disappears after a directional push.
They show initiative activity versus responsive activity, who is acting first and who is reacting.
Most importantly, they show when price movement and order flow disagree. That disagreement is often where the edge lives.
How Order Flow Traders Use Footprints
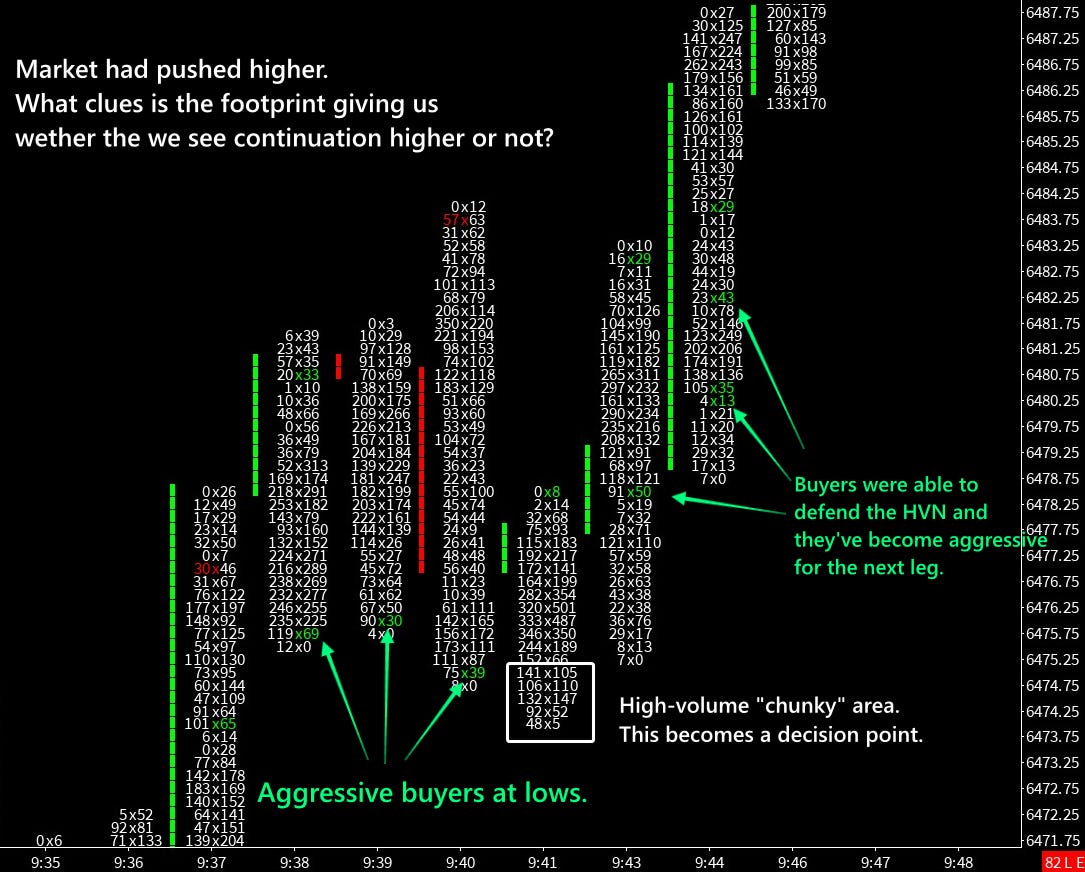
In practice, footprints help traders stop asking “what could happen” and start asking “what is happening right now.”
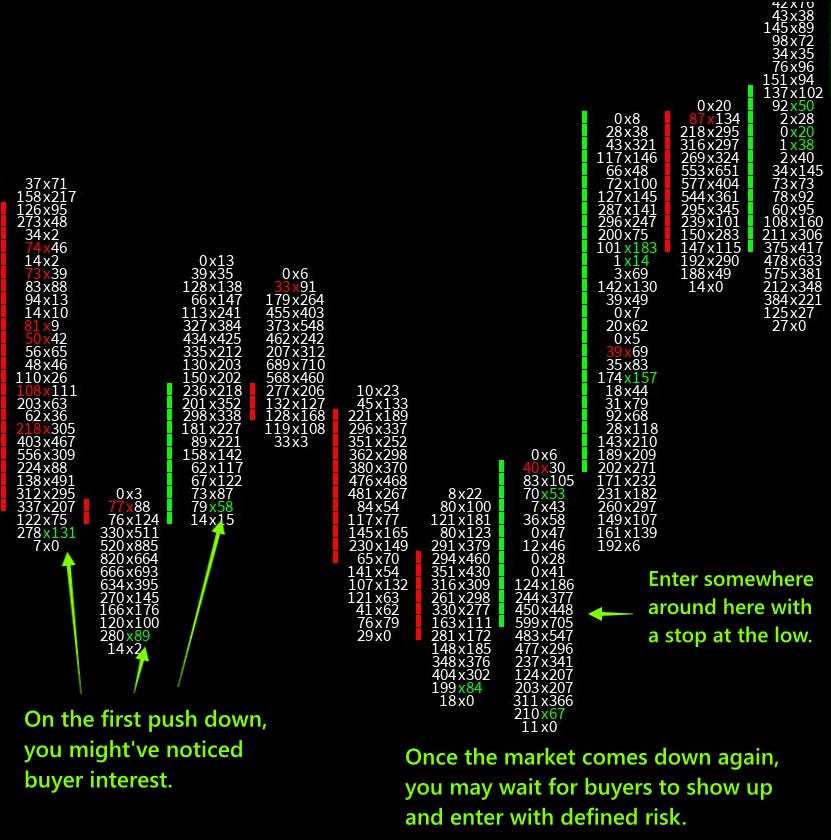
All of the examples above use a 5000 trade chart. There’s no magic number, this is just what I chose to use. Different timeframes will provide visibility into different nuances left behind by traders.
Why Footprint Charts Become Indispensable
Once you start making decisions based on executed trades instead of derived indicators, it’s hard to go back.
Footprints anchor your read of the market in actual transactions.
They reduce reliance on lagging signals, and they expose when your narrative doesn’t match reality.
For discretionary order flow traders, they become less of a feature and more of a baseline. Not because they’re perfect, but because they’re honest.
Common Friction
Most frustration with footprint charts comes from misuse.
Staring at numbers without proper interpretation.
Hunting for patterns instead of behavior.
Anticipating behavior before the market confirms the narrative.
Footprints are not a silver bullet, they’re a powerful tool which will demand better discretion from you.
Footprints in a Broader Framework
Footprint charts work best when they’re the last layer, not the first.
If you haven’t done so, read our series on Market and Volume Profile first.
Higher-timeframe structure defines the battlefield.
Value and liquidity define areas of interest.
Footprints show how participants behave once price gets there.
That sequence matters.
Closing Thoughts
Footprint charts won’t make trading easy. They won’t remove uncertainty and they don’t guarantee what happens next.
What they will do is show you what is actually happening now.
For order flow traders, that distinction is everything.
Not certainty or assumptions, but clarity and understanding.
And once you start trading from that place, it’s very hard to trade any other way.
ps. It’s been years since I’ve used a single technical indicator in any lower-timeframe chart!
If you enjoyed this free post, please help us out by liking and sharing!
Legal Disclaimer
The content provided in this newsletter is for educational and informational purposes only and does not constitute financial, investment, trading, or any other form of advice. All views, opinions, and analyses expressed are those of the author and should not be interpreted as personalized recommendations to buy, sell, or hold any security, futures contract, option, or other financial instrument.
Trading futures, options, and equities involves substantial risk of loss and is not suitable for all investors. Past performance is not indicative of future results. You should carefully consider your financial situation, risk tolerance, and objectives before engaging in any trading activity.
The author and Beyond Candlesticks make no representations or warranties regarding the accuracy, completeness, or suitability of the information provided. We shall not be liable for any errors, omissions, or delays in the content, or for any actions taken in reliance thereon.
You alone are responsible for your own trading decisions and outcomes. Consult a qualified financial professional before making any investment or trading decisions.