

Convexity
Understanding the curvature behind nonlinear returns and hedging flows
Convexity is one of the most important structural concepts in options.
It explains why option returns are nonlinear, why dealer hedging can accelerate price moves and why gamma exposure matters intraday.
Most traders are introduced to delta first.
Delta measures how much an option price changes for a small move in the underlying.
Convexity explains how that sensitivity itself changes as price moves.
And that distinction is foundational.
From Linear Exposure to Curvature
A share of stock has linear exposure.
If price moves one point, the position gains or loses one point.
An option does not behave this way.
Its value changes along a curve.
Mathematically, if option value is written as:
Then:
Delta (Δ) is the first derivative with respect to price.
It measures slope.Gamma (Γ) is the second derivative.
It measures curvature.
Convexity is positive gamma.
Long calls and long puts have positive convexity.
Short options have negative convexity.
This is not just theoretical. It directly affects risk and positioning.
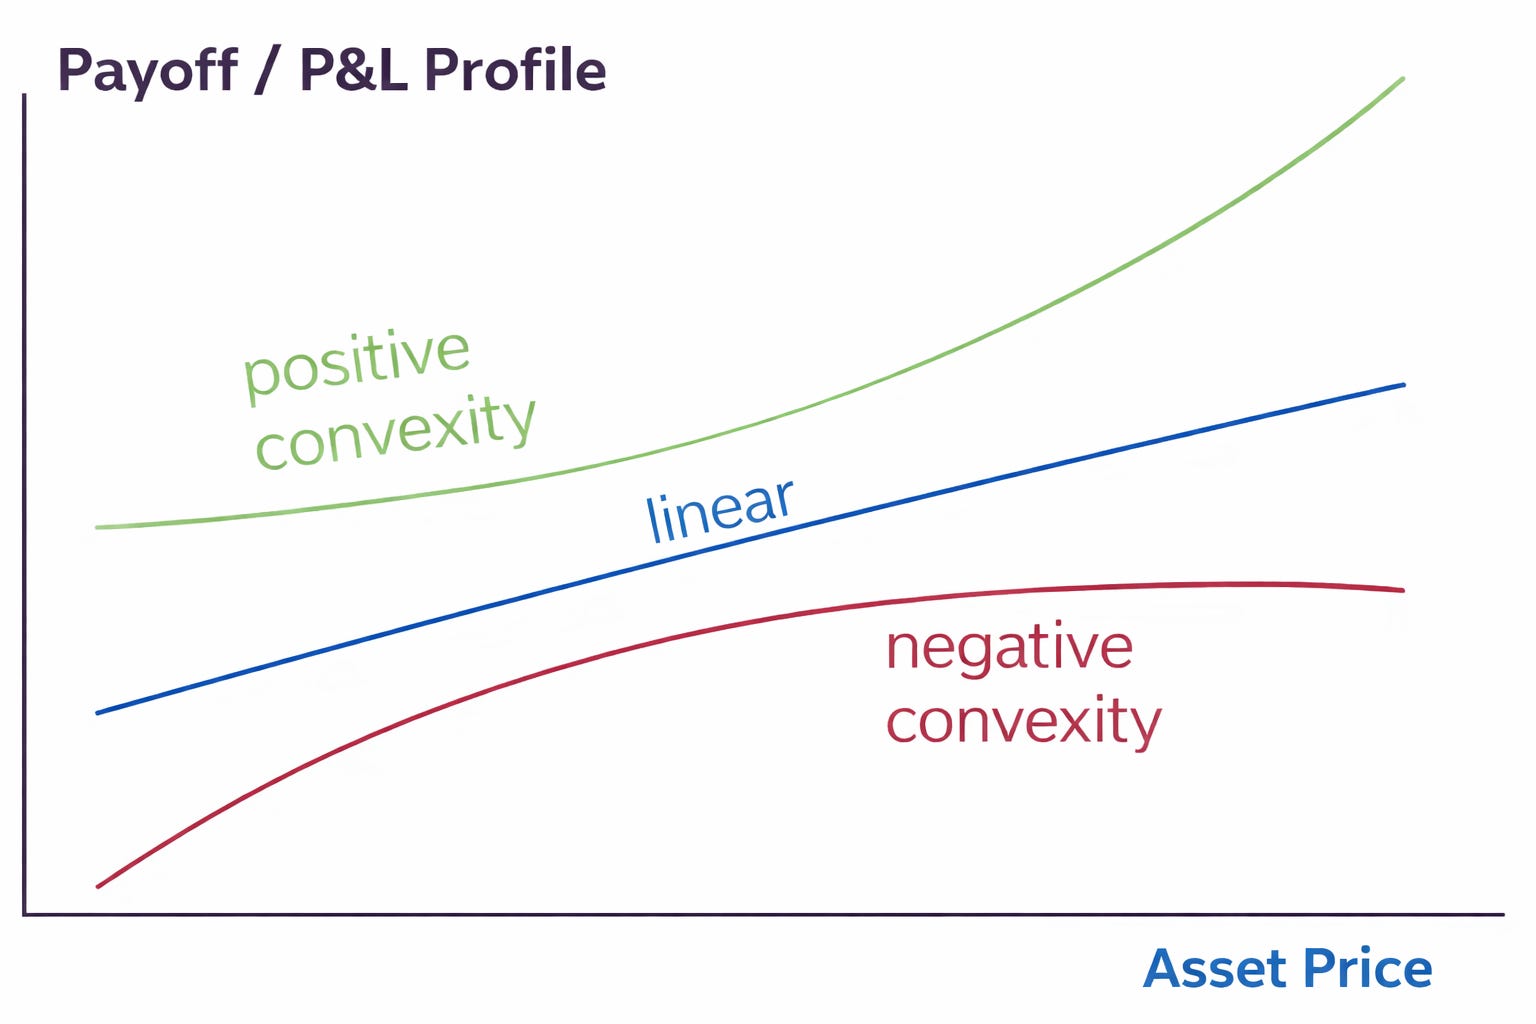
Long Call: Positive Convexity
The payoff curve bends outward.
As price increases, delta increases.
If an at-the-money call starts with a delta of 0.50 and price rises, delta may increase to 0.55, then 0.60, and so on.
Exposure expands as the trade moves in your favor.
If price declines, delta contracts.
Exposure shrinks as the trade moves against you.
That asymmetry defines positive convexity:
Gains accelerate.
Losses decelerate.
The curvature creates nonlinear returns.
Short Call: Negative Convexity
The curve bends inward.
If price rises, the position becomes increasingly sensitive.
Delta grows as the trade moves against you. Losses accelerate.
If price declines, delta collapses and gains slow.
This is negative convexity.
From a risk perspective, negative convexity means exposure expands in adverse conditions.
That dynamic becomes particularly important when large participants are structurally short gamma.
A Practical Example
Consider:
Stock at 100.
ATM call.
Delta = 0.50.
Gamma = 0.05.
If price moves to 101: Delta becomes 0.55.
If price moves to 102: Delta becomes approximately 0.60.
Sensitivity is not static, but you get the point.
Each incremental move increases directional exposure.
This compounding sensitivity is convexity in action.
Why Convexity Matters in Index Markets
Convexity does more than shape individual option returns.
It influences market structure.
When dealers are short gamma, they are short convexity.
As price rises, they must buy to hedge.
As price falls, they must sell to hedge.
This creates procyclical flows.
In positive gamma environments, hedging tends to dampen volatility.
In negative gamma environments, hedging can amplify moves.
This is one of the structural mechanisms behind:
Intraday accelerations.
Volatility expansions.
Squeezes and air pockets in $ES and $SPX.
Gamma exposure analysis is fundamentally an analysis of aggregate convexity in the system.
Convexity and Volatility Regimes
Long gamma positions benefit from movement itself. They monetize realized volatility.
Short gamma positions benefit from stability and compression.
Tough to be a dealer, eh?
Understanding the prevailing convexity regime helps frame expectations:
Is the market positioned to dampen moves?
Or is positioning likely to amplify them?
This context is often more useful than directional bias alone.
Summary
Convexity in options is:
The curvature of the price function.
Mathematically represented by gamma.
Economically expressed as asymmetric risk.
Structurally responsible for dynamic hedging flows.
Delta tells you your current exposure.
Gamma tells you how that exposure will evolve.
For traders focused on order flow, gamma exposure, and intraday futures behavior, convexity is not an abstract Greek.
It is a structural force embedded in the market.
This was a foundational post, in future posts, we will dive into Exotic Greeks.
Legal Disclaimer
The content provided in this newsletter is for educational and informational purposes only and does not constitute financial, investment, trading, or any other form of advice. All views, opinions, and analyses expressed are those of the author and should not be interpreted as personalized recommendations to buy, sell, or hold any security, futures contract, option, or other financial instrument.
Trading futures, options, and equities involves substantial risk of loss and is not suitable for all investors. Past performance is not indicative of future results. You should carefully consider your financial situation, risk tolerance, and objectives before engaging in any trading activity.
The author and Beyond Candlesticks make no representations or warranties regarding the accuracy, completeness, or suitability of the information provided. We shall not be liable for any errors, omissions, or delays in the content, or for any actions taken in reliance thereon.
You alone are responsible for your own trading decisions and outcomes. Consult a qualified financial professional before making any investment or trading decisions.