

Contango and Backwardation
In futures curves
Futures curves quietly tell you what the market cares about most.
Not direction or momentum.
But time, availability, and urgency.
Understanding contango and backwardation is less about forecasting price and more about reading the state of the underlying market. Especially for storable commodities and rate-sensitive products, the curve often reveals more than the front-month chart ever will.
What a Futures Curve Represents
A futures curve plots prices for the same asset across different delivery months.
Each point on the curve answers a simple question:
What price does the market demand for delivery at a specific point in the future?
The shape of that curve reflects three forces:
Cost of carry (financing, storage, insurance).
Expectations about future supply and demand.
Urgency for immediate ownership versus delayed delivery.
From that interaction, two common structures emerge.
Contango: The Normal State
Contango occurs when future contracts trade at higher prices than the spot or front-month contract.
This is typical for most storable commodities.
Why? Because holding the physical asset has real costs:
Capital is tied up and earns no interest.
Storage and insurance are required.
Operational risk exists over time.
Those costs are embedded into forward prices. The further out the contract, the more carry is priced in.
What contango usually signals:
Adequate physical supply.
No urgency to own the asset immediately.
A market willing to wait.
In contango, time has value. The market charges you for it.
Backwardation: When Urgency Takes Over
Backwardation occurs when near-term contracts trade above longer-dated contracts.
In simple terms, the market is saying:
I will pay a premium to own this now.
For non-storable commodities, backwardation can be common.
For storable commodities, it is more unusual and more informative.
Backwardation suggests that immediate access is more valuable than future delivery. That urgency overwhelms the normal cost of carry.
What backwardation often reflects:
Tight spot supply
Delivery stress
Strong immediate demand
Incentives to release inventory rather than store it
In these conditions, time becomes a liability instead of an asset.
A Recent Example: Silver
Silver is the talk of the town right now so here’s an excellent examle.
In a normal environment, silver forwards trade above spot. Storage, insurance, and financing costs push the curve into contango.
But when short-term silver swap rates fall below comparable interest rates, the curve can flip.
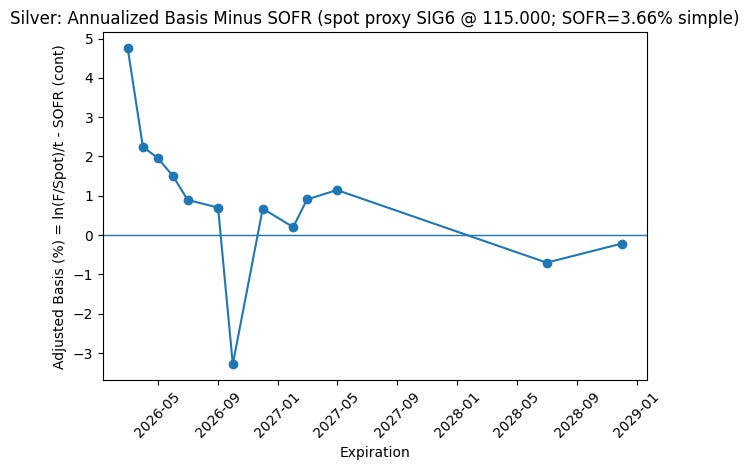
The chart above shows the silver futures curve expressed as annualized basis minus SOFR. It assumes 3.66% SOFR and uses all $SI futures prices from Jan 28, 2026 onwards. For a better picture you’d want to plot the historical data too.
In simple terms, this isolates one question:
After accounting for the time value of money, is the market paying you to delay delivery, or paying you to own silver now?
Near-Term: Inversion Relative to Rates
The front part of the curve sits well above where a pure financing model would imply.
Contracts only a few months out are trading at an annualized premium relative to the spot proxy, even after subtracting SOFR. That should not happen in a relaxed, well-supplied market.
This is the signature of immediate demand.
The market is effectively saying that near-term access to silver is more valuable than cash. Financing costs are no longer the dominant factor. Availability is.
Mid-Curve: Persistent Tightness
As we move further out, the adjusted basis compresses but remains near or slightly above zero for most maturities.
That tells us something important. This is not a single-month anomaly.
The pressure extends across much of the curve.
When backwardation shows up only in the front contract, it can often be dismissed as positioning or technical noise. When it persists across multiple expiries, it points to broader tightness in the physical market.
Where the Curve Breaks Down
There are pockets where the curve briefly dips negative again. These are not signs of abundance.
They usually reflect:
Thin liquidity in certain delivery months.
Calendar structure quirks.
Temporary dislocations rather than relief.
The key observation is not the exact level of each point, but the overall shape.
The Takeaway
Once you strip out interest rates, the silver curve is no longer behaving like a typical storable commodity.
Time is not being rewarded and delay is not being discounted.
The market is attaching a premium to immediate ownership, and that premium is large enough to overwhelm financing costs.
That is what backwardation really represents.
It implies that lending silver earns more than holding cash. In other words, the market is compensating holders for giving up physical metal today.
While silver is not the focus of this post, it highlights an important principle:
Backwardation is not about opinion.
It is about relative scarcity right now.
How to Identify Contango vs Backwardation
Rather than relying on labels or intuition, the most reliable way to identify contango or backwardation is to strip the curve down to rates and time.
Below is a simple, repeatable process you can use to do that yourself.
1. Gather the Data
You only need three inputs.
A. Futures Prices and Expirations
Go to the CME page for the contract you’re analyzing and collect:
Contract expiration months.
Last traded prices.
For example, for silver:
https://www.cmegroup.com/markets/metals/precious/silver.quotes.html
You don’t need every contract listed. Focus on:
The nearest non-expired contract (this is your spot proxy).
A reasonable range of forward expirations.
B. Current Date
Use today’s date. This matters because time to maturity is explicitly part of the calculation.
C. SOFR Rate
Use the latest SOFR rate published by the New York Fed:
https://www.newyorkfed.org/markets/reference-rates/sofr
Make sure you note:
The rate as a simple annual percentage.
The date it applies to.
2. Download the Prompt
Use the prompt below (just copy/paste).
The goal is consistency. If you change the math or the compounding conventions, the interpretation changes.
You can reuse it for any commodity or futures curve.
3. Paste into your LLM of Choice
When prompting:
Paste the prompt instructions.
Paste the table of expirations and prices.
Today’s date.
Include:
The current date.
The SOFR rate you’re using.
Hopefully you get a chart on the other end.
What the Curve Is Telling You
After adjusting for rates, the futures curve reveals urgency, not direction.
In contango, time is rewarded.
In backwardation, immediacy is.
Backwardation is not a forecast. It is the market placing a premium on owning now rather than later.
And that information doesn’t live on a candlestick.
It lives in the curve.